Class aptent sociosqu ad litora torquent per conubia nostra, per inceptos himenaeos. In tempus, erat eget tincidunt elementum mauris quam laoreet erat.
Forex Chart Patterns
Double Tops and Bottoms.
Double Top.
Double tops occur during an uptrend in which a pair is unable to break through a top on two separate occasions. When this occurs the price has a chance to reverse downwards.
Double Bottom.
Double bottoms are similar to double tops except instead of being unable to break through a new high, the price is unable to break through a new low. The double bottom indicates that the price might reverse upwards.
Head and Shoulders and Inverse Head and Shoulders.
Head and shoulders patterns and inverse head and shoulders patterns are named after what the patterns look like.
Head and Shoulders.
In a head and shoulders pattern there are three highs. The high in the middle is the highest of all of them. If the pattern occurs after a recent uptrend, the pattern signals for a reversal downward if it breaks through the neckline.
In an inverse head and shoulders, there are three lows with the low in the middle being the lowest low. If the pattern occurs after a recent downtrend, the inverse head and shoulders will signal a reversal upwards if it breaks through the neckline.
Inverse Head and Shoulders.
Both the head and shoulders pattern and the inverse head and shoulders pattern have a “neckline”. The neckline is the price level in which the price retreats and bounces off of after hitting the highs/lows. The pattern only indicates a buy/sell opportunity if it breaks through the neckline after the pattern is made.
Rising Wedges.
A rising wedge is a chart pattern that signals an upcoming downtrend. The pattern is defined by consolidation upwards, or a “rising wedge”, and then prices break downwards after the consolidation. The pattern can be defined as having higher highs and higher lows, until the consolidation can no longer continue. Lastly, the price action after the pattern isn’t affected by the price action before the pattern.
Falling Wedges.
Falling wedges are similar to rising wedges but prices consolidate downwards and are normally followed by a breakthrough upwards. The consolidation can be defined as lower lows and lower highs, in which prices break upwards after the consolidation completes. Similar to rising wedges, it doesn’t matter if the falling wedge occurs during an uptrend or a downtrend.
Bullish and Bearish Pennants.
The similarity with bullish and bearish pennants to rising and falling wedges is that they have periods of consolidation. One difference is that pennants are followed by continuations of the trend that came before it. Another is that the consolidation doesn’t have to be in a certain direction; it just needs to close in on a single price.
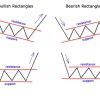
Bullish and Bearish Rectangles.
Bearish and bullish rectangles can be seen as a consolidation in prices, in which a price is stuck within a range. What separates a bearish and bullish rectangle is what happens before the consolidation. The price action before a rectangle determines how the price will change in the future.
Bullish rectangles are preceded by an uptrend, and are normally followed by a continuation of the uptrend once the price breaks through the resistance.
Bearish rectangles are preceded by a downtrend and are normally followed by a continuation of the downtrend once the price breaks through the support.
The price change following a rectangle is normally the size of the range that it was stuck in.
Read More
Posts not found
Sorry, no other posts related this article.


![]()
![]()